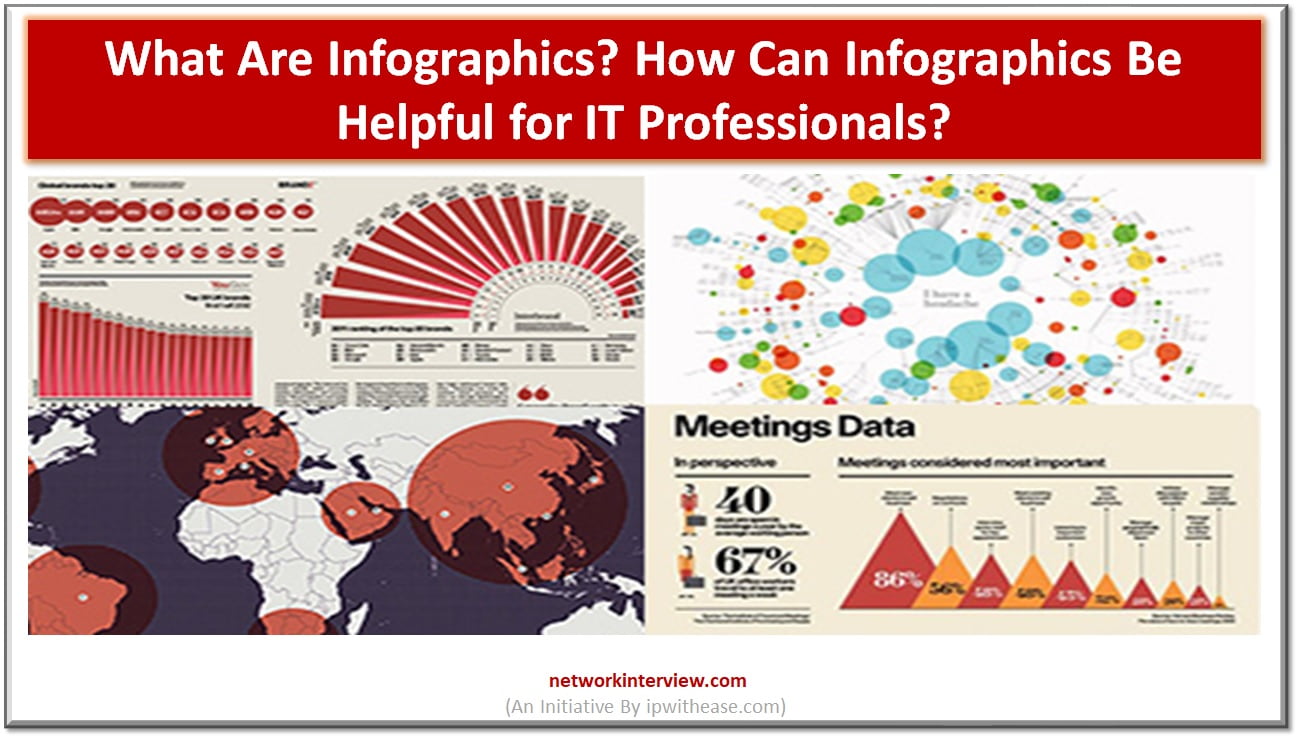
What Are Infographics? How Can Infographics Be Helpful for IT Professionals?
What are infographics and how can they be useful for IT professionals? We’re explaining the answers along with tips on how to make infographics that resonate.
Have you heard of infographics? You know about other formats that are great for content marketing. But, have you ever tried infographics for your marketing strategies?
Many people still don’t know what infographics are. Using them has many incredible benefits, which other content formats don’t have.
If you’re an IT professional or want to be one, keep reading this guide. Learn how infographics can help you, and why you should invest in them.
What Are Infographics?
Infographics are visual representations of data, information, or knowledge. It has graphics, icons, charts, and other visual elements. This is to present complex concepts in a simplified and engaging manner.
They transform raw data into appealing designs. They make it easier for the audience to understand and remember the info presented.
Infographics often combine text, statistics, and visuals. With this, they create a comprehensive narrative that is both informative and stimulating.
How Can Infographics Be Helpful?
Infographics are valuable for IT professionals. By representing technical information, infographics make it easier to understand and remember.
They also grab attention, making presentations and reports more engaging. Here are some of the other benefits of using infographics:
- Simplify Complex Concepts: IT is a complex field with intricate processes and technical jargon. Infographics can help IT professionals simplify these concepts. They can present them in a way that is understandable for a non-technical audience. Infographics break down complex ideas into bite-sized visual elements. They make it easier for viewers to grasp the main points and understand the message.
- Enhance Data Communication: IT professionals often deal with large volumes of data, statistics, and trends. Infographics provide an appealing way to present this data. It allows IT professionals to communicate information better. Infographics incorporate charts, graphs, and icons. With these, they can illustrate data trends, comparisons, and correlations. This makes the information more memorable and impactful.
- Increase Engagement: Visual content captures attention and engages viewers more than text alone. IT infographics leverage the power of visuals. These create compelling narratives that grab the audience’s attention. It is beneficial to use infographics for IT professionals. They make their presentations, reports, or marketing materials more engaging and captivating. This increases the likelihood of information retention.
- Ease Knowledge Sharing: IT professionals often need to share their expertise and knowledge. Infographics offer an appealing and concise format for presenting information. This makes it easier for others to understand complex IT concepts. They can also be helpful for IT professionals in conducting research. They provide an organized format to help with your search for relevant information.
- Improve Information Retention: Visual content is better retained in memory compared to plain text. Infographics leverage visual cues and storytelling elements to enhance information retention. Infographics use color, icons, and illustrations. This creates a visual hierarchy that guides the viewer’s attention. It also aids in remembering key points.
Using Infographics in the IT Field
Infographics can be highly useful for IT professionals in several ways:
- Data Visualization: IT professionals often deal with complex data and technical information. Infographics provide a visually appealing way to represent data, making it easier to understand and interpret. By condensing complex concepts into simplified visuals, infographics enable IT professionals to communicate information more effectively, whether it’s for presentations, reports, or training materials.
- Process Flow and System Architecture: Infographics are excellent for illustrating process flows and system architectures. IT professionals can use infographics to showcase the various components, interactions, and dependencies within a system. This helps in conveying complex technical workflows in a clear and concise manner, aiding in troubleshooting, documentation, and training.
- Comparison and Analysis: Infographics are ideal for comparing different IT solutions, technologies, or products. IT professionals can create visual comparisons that highlight the features, pros and cons, performance metrics, or cost considerations of different options. This enables informed decision-making and allows stakeholders to quickly grasp the key differences between choices.
- Instructional Guides: IT professionals often need to provide instructions or tutorials to users or colleagues. Infographics can be used to create step-by-step guides, illustrating processes, configurations, or troubleshooting procedures. With clear visuals, IT professionals can simplify complex instructions and make them more accessible, leading to better user adoption and understanding.
- Security Awareness and Best Practices: IT professionals play a crucial role in promoting cybersecurity and best practices within an organization. Infographics can be employed to raise awareness about common security threats, explain security protocols, and provide tips for secure practices. The visual nature of infographics increases engagement and retention of important security information.
- Data Presentations: IT professionals are often required to present data-driven insights or metrics to management or clients. Infographics offer an engaging and visually stimulating way to present data, enabling the audience to grasp key insights quickly. IT professionals can leverage infographics to showcase performance metrics, project milestones, system analytics, or any other data relevant to their audience.
Overall, infographics serve as powerful tools for IT professionals to simplify complex information, enhance communication, and improve understanding among diverse audiences. By leveraging visual elements effectively, IT professionals can streamline their work, increase efficiency, and create impactful deliverables.
Try creating your infographic for your next project and feel the difference!
Continue Reading:
What are Progressive Web Apps (PWAs)? A Comprehensive Guide
Impact of Automation on the IT Sector


