Easing Network Visualization with Network Diagram Software
Network visualization is more important than ever in this dynamic business world where businesses are scaling their networks constantly to meet increasing demand. Having comprehensive knowledge about the layout of one’s network is no longer a luxury but an unwritten mandate. Tackling network management without proper knowledge of the network’s layout is a nightmare, and this is where network diagrams come into play. Network diagrams are a pictorial representation of a network, and they primarily help network admins with visualization. Using network diagram software, network admins can create legible network diagrams that make network visualization much easier.
Challenges faced while drawing a Network diagram
- The dynamic nature of networks
Due to varying workloads, enterprise networks are becoming more dynamic nowadays. Network admins might find this dynamic nature of the network troublesome since it causes constant changes in the network layout, and that further hinders visualization.
- Network complexity
Enterprise networks comprise many devices, ports, and interfaces. Due to their dynamic nature and the sheer number of devices they are associated with, enterprise networks are very complex. Drafting a network diagram for such a large network while getting the devices mapped correctly with each other is labor-intensive.
- Time-consuming tasks
Considering the colossal size of enterprise networks, drawing a network diagram might be time-consuming.
Types of Network Diagrams
Physical Network Diagrams | Logical Network Diagrams | |
| 1. | A physical network diagram is a visual schema of a network. This type of network diagram is associated with the physical aspects of a network.
| A logical network diagram is a pictorial representation of a network in terms of its data flow.
|
| 2. | The lines represent the connection between devices.
| The lines represent the flow of data between devices.
|
| 3. | They are used to understand the physical layout of a network.
| They are used to understand how devices in a network communicate with each other.
|
Types of Network Views
Visualizing your network in different views is imperative since it helps you get a clear understanding of the network. Network diagram software must visualize your network in the form of geographical views and topological views.
Geographical views
Geographical views allow you to visualize your network in terms of its real-world locations. The different types of geographical views are:
- Business views: Business views are used to visualize your network based on business services or locations. An enterprise network has many widespread devices. Identifying the status of these devices and the traffic load of the devices as well as the entire network could be difficult. But with business views, you can easily monitor device status and also view traffic loads. You can even drill down to the device snapshot pages while visualizing devices with customized maps.
- Maps: Overcome the geographic barriers in your visualization efforts by using maps. With the help of maps, you can visualize your network in terms of its real-world locations. Maps help in the planning and expansion of widespread enterprise networks that are distributed geographically. They also provide you with a comprehensive view of the status of the devices in your network, along with their geographical layout, under a single window.
Topological views
Visualize your network’s hierarchy with topological views. The various types of topological views are:
- Layer 2 maps: Layer 2 maps are one of the most sought-after visualization formats. Network visualization is tedious, but Layer 2 maps ease the visualization process by automating it. All the devices are discovered, mapped, and portrayed legibly in the click of a button. Since Layer 2 maps depict the physical topology of a network, they portray network devices in a parent-child relationship. Any problem with the parent device might lead to a problem with the child device, so knowing the parent-child relationships in the network makes fault identification and rectification as hassle-free as possible.
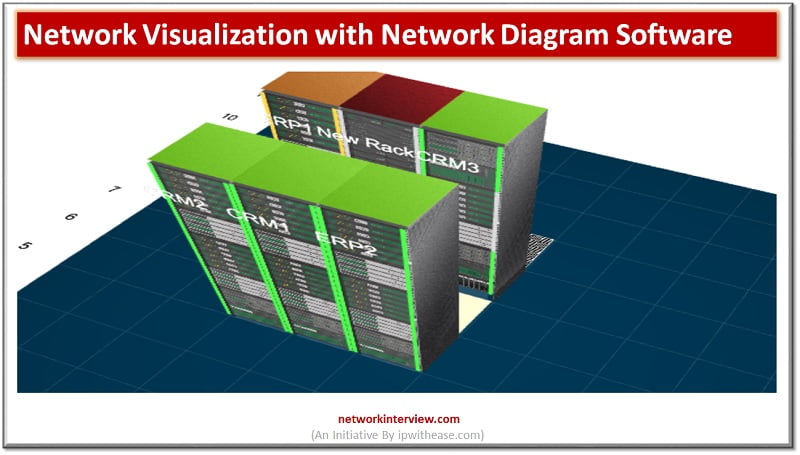
- 3D floor views: Visualize the servers and switches in your network with network diagram software’s 3D floor views. This aids your network management process and identifies probable locations for installing new servers and switches. Color-coding in 3D floor views tells you the status of switches and servers and helps with identifying the faulty ones.
- 3D rack views: Network diagram software’s 3D rack views allow you to create virtual racks or custom racks that can later be used to populate devices. 3D racks help you visualize networks by their physical arrangement in data centers or server rooms. You can also group devices that are involved in a common business purpose. Like 3D floor views, 3D rack views ease the fault identification process by using a color code. You can also drill down to the device snapshot page from the rack views.
OpManager: The Network Diagram Software you need
OpManager, holistic network monitoring and network diagram software, helps network admins with complex visualization processes. It breaks them down into granular views that give you an in-depth understanding of your network while still being easy to interpret. Leverage the power of OpManager’s diversified visualization views by installing the solution.
Continue Reading:
What is Network Discovery? Effective Network Discovery Tools
Tag:services


