What Are Block Diagrams and Why Your Teams Should be Utilizing Them?
Block diagrams are powerful visual tools that help simplify complex systems and processes by breaking them down into interconnected blocks or functional units. They provide a high-level overview of the components and relationships within a system, enabling teams to better understand and analyze its structure and functionality.
To create block diagrams efficiently and effectively, teams can utilize specialized software tools like a block diagram maker. In this article, we will explore what block diagrams are, how they work, and why your teams should be utilizing them.
What is a Block Diagram?
A block diagram is a visual representation that simplifies complex systems or processes by breaking them down into interconnected blocks or functional units. Each block represents a specific component or function within the system, and the connections between blocks illustrate the flow of information or the relationships between components. The purpose of a block diagram is to provide a high-level overview and understanding of a system or process, allowing teams to analyze and optimize its structure or functionality.
Why Utilize Block Diagrams?
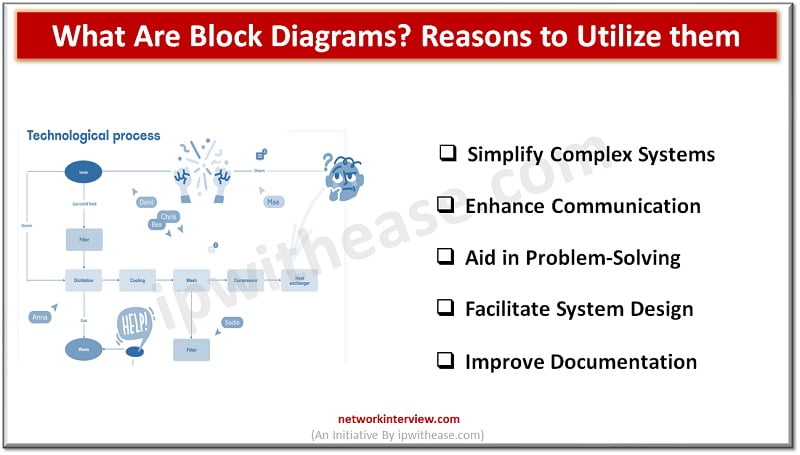
- Simplify Complex Systems: Block diagrams help simplify complex systems by breaking them down into manageable blocks. This enables teams to understand the overall structure and interdependencies between components, making it easier to identify areas of improvement or troubleshoot issues.
- Enhance Communication: Visual representations are often more effective in conveying complex ideas than written descriptions. Block diagrams provide a clear visual representation of systems or processes, making it easier for teams to communicate and understand complex concepts. This enhances collaboration, reduces misunderstandings, and ensures everyone is on the same page.
- Aid in Problem-Solving: When faced with a problem or inefficiency within a system, block diagrams can be used to analyze the root causes and identify potential solutions. By visually mapping out the components and interactions, teams can identify bottlenecks, areas of improvement, or potential points of failure. This enables more targeted problem-solving and effective decision-making.
- Facilitate System Design: Block diagrams are widely used in the design phase of systems or processes. They allow teams to explore different architectures, evaluate design options, and make informed decisions. By visually representing the system’s components and their relationships, teams can optimize the design and ensure that the final solution meets the desired objectives.
- Improve Documentation: Documentation is crucial for maintaining and updating systems or processes. Block diagrams serve as visual documentation that provides a concise overview of the system’s structure and functionality. They can be easily referenced and updated, ensuring that the documentation remains accurate and up-to-date.
How to Create a Block Diagram?
Creating a block diagram involves several steps:
- Identify the System or Process: Determine the system or process that you want to represent in the block diagram. This could be a physical system, a software application, or a business process.
- Identify the Components: Identify the key components or functional units of the system or process. These could be hardware components, software modules, or departments within a business process.
- Define the Relationships: Determine the relationships between the components. This could be the flow of information, dependencies, or interactions between components. Consider how data or signals flow between the blocks.
- Draw the Blocks: Represent each component as a block or rectangle. Label each block with the name or description of the component.
- Connect the Blocks: Draw lines or arrows to connect the blocks, representing the relationships or interactions between components. Use appropriate symbols or annotations to indicate the nature of the connection (e.g., data flow, control flow).
- Add Descriptions: Include additional information or descriptions within the blocks or annotations to provide further clarity or context.
- Review and Refine: Review the block diagram for accuracy, clarity, and completeness. Seek feedback from team members or stakeholders to ensure that the representation accurately reflects the system or process.
Final Words
Block diagrams are powerful tools for simplifying complex systems, enhancing communication, aiding in problem-solving, facilitating system design, and improving documentation. By utilizing block diagrams, your teams can gain a clearer understanding of the systems or processes they are working with, enabling more effective analysis, optimization, and decision-making.
With the right tools and a structured approach, your teams can leverage block diagrams to enhance their problem-solving capabilities and drive success in their projects. So, start incorporating block diagrams into your team’s toolkit and unlock the power of visual representation for improved understanding and collaboration.
Continue Reading:
What is Agile SDLC? – Complete explanation of Agile SDLC Model
What Are Infographics? How Can Infographics Be Helpful for IT Professionals?


