Troubleshooting FortiGate Firewall Issues: Common Errors and Fixes
Like any other devices, firewalls do face disruptions and issues. For network administrators network disruptions due to firewall issues is critical as suddenly users cannot access critical resources, application failures occur, and expectation is to restore services to As-IS state at the earliest.
FortiGate firewalls are powerful next generation firewalls (NGFW’s) are feature abundant but the complex nature of these firewalls does account for configuration errors that sometimes creep in which lead to network downtime or disruptions.
In this article we will learn more in detail about identifying and troubleshooting FortiGate firewall uses, what are common errors and how to fix them.
Troubleshooting FortiGate Firewall Issues
Before we go deeper into common issues faced by FortiGate firewalls and remedies for them, let’s look at some essential troubleshooting tips and techniques.
- Backups – Always maintain the current backup of FortiGate firewall configuration before making any changes which acts as a safety net.
- Change Control Mechanism – should have a robust change management process in place and document whatever changes being made
- Understand the Purpose – the change in configuration would impact what all? Which traffic is blocked / allowed, VPN use etc.
FortiGate built-in Troubleshooting Tools
FortiGate provides four built-in tools for troubleshooting common issues:
- Log Viewer – logs are the first thing every administrator looks at if something goes wrong. Check forwarding traffic, event logs of system, security and VPN, users, UTM logs to be inspected – web filter, IPS etc.
- Policy Lookup – check firewall policy under policy 🡪 objects tab. Input source/destination IPs, protocol and port to identify policy matching with traffic
- FortView – To identify top talkers and unusual patterns FortView is a useful tool which provides dashboards, traffic visualizations, destination, sources, ports, protocols, threats etc.
- Routing Monitor – tool is used to view active routing tables. Use tab monitoring under the network.
- Packet Capture – Specific interfaces traffic can be captured and viewed in GUI under packet capture tab in network option.
CLI Tools – GET and DIAGNOSE
CLI tools are considered more useful in troubleshooting common issues.
CLI is accessed via SSH or from GUI in the console widget. The GET and DIAGNOSE are particularly useful here.
- Diagnose debug flow – this is used in packet level troubleshooting. This shows how the packet traversed the firewall and which policy hit it and why the packet is getting dropped. It requires it to be disabled once the work is done.
- Diagnose sniffer packet any ‘host <ip_address> and port <port_number>’ 301: a powerful packet sniffer command – host and port are critical inputs to diagnose issue
- Get system status – command provides basic information such as version, serial number etc.
- Get performance status – command provides statistics on CPU and memory usage, session count etc. help in identification of resources utilization related issues
- Diagnose sys session list – command let you view action sessions in session table
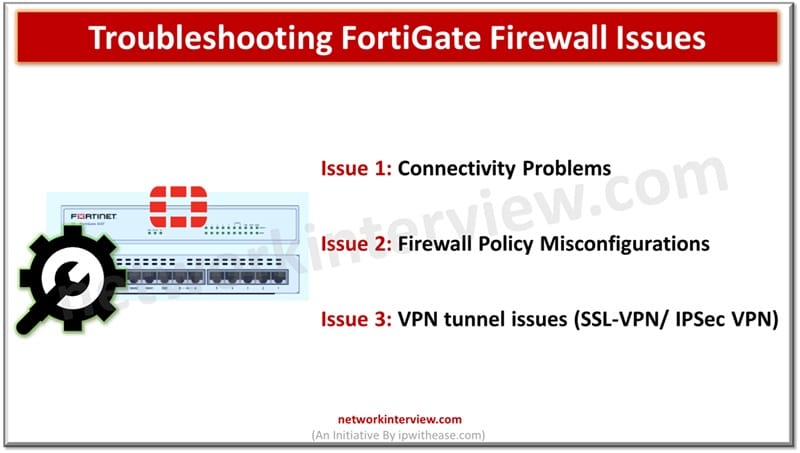
Common FortiGate Firewall Issues
Issue 1: Connectivity Problems
No internet / can’t reach internal resource
Symptoms
Users reporting no access to Internet or failure to connect internal applications and services
How to troubleshoot?
- Check Interface – Verify whether interface WAN or LAN is up from network 🡪 Interfaces tab or CLI (Physical connectivity). Verify IP address, netmask, gateway
- Check Routing – FortiGate default route (0.0.0.0/0) points to correct interface verification from routing monitor or CLI. Check the FortiGate route to the internal network.
- Verify firewall policies from Policy and objects tab under firewall policy. If policy enabled to allow traffic from source interface/IP address/zone to destination interface/ IP address and zone with right protocol / port
- NAT – outbound internet access policies have NAT enabled and outgoing interface address is setup
- Policy lookup tool – policy ID to match verify from GUI tool
- Diagnose debug flow – use CLI command for specific traffic to verify which policy ID is hit or denied
- Check for DNS – is FortiGate able to resolve external domains.
- Does client’s configuration define a working DNS server and verify client IP configuration settings
- Check logs – Filtering Forward traffic logs to verify action of ‘Deny’ and check log details to identify cause.
Issue 2: Firewall Policy Misconfigurations
Symptoms
Allowed traffic is getting blocked or unwanted traffic is being allowed
How to troubleshoot?
- Identify traffic – identify what traffic is flowing by viewing source/destination IP address, port and service
- Use Policy Lookup (GUI): By providing traffic parameters identify if they match the policy what is expected to do?
- Diagnose debug flow (CLI) – Filter (diag debug flow filter saddr <source_ip> daddr <dest_ip> dport <dest_port>). Execute trace command to understand Allowed by policy and reason for denial.
- Policy order review – evaluation of policies from top and down as first matching policy is applied so if broader policy placement is above specific policy, then it would impact traffic flow.
- Check policy details – verify policy details to ensure incoming / outgoing interfaces correctly defined, address objects are accurate, correct service port / protocol is defined
- Security profiles – UTM features enabled via policy could also be blocking traffic so web filter logs need to be checked
- Check logs – source/destination IP address logs to be checked and policy ID column to ensure policy is hitting as expected
Issue 3: VPN tunnel issues (SSL-VPN/ IPSec VPN)
Symptoms
VPN tunnels failing to establish or if established do not pass traffic
How to troubleshoot?
For IPSec Site-to-Site issue
- Check status of IKE in Phase – I (ike)
- Debug using diagnose vpn to initiate tunnel and watch logs
- Common errors could be proposal mismatch, pre-shared key (PSK) mismatch or incorrect Remote gateway IP address or peer ID.
- Verify Phase-I settings on FortiGate’s
- For Phase 2 (IP Sec) check status
- Debug to check phase 2 negotiation
- Common errors could be proposal mismatch, selector mismatch
- On both peers check selectors and proposals
- Firewall policies – check policies for both allow traffic into tunnel and out of tunnel
- Routing – is route pointing the remote subnet towards IPsec tunnel interface
- NAT traversal settings to be checked if peer is behind the NAT device
- Logs – check VPN events in logs and forward traffic logs
For SSL-VPN Issue
- Connectivity – is remote client ale to reach firewall public IP address
- Authentication – check user credentials, check SSL-VPN settings, verify right groups assigned, test backend servers and check logs
- Portal settings – is tunnel mode enabled and configured correctly
- Web mode – verify if bookmarks are properly configured
- Tunnel mode specific – Check for IP pool
- Firewall policy – policy required from SSL VPN tunnel interface to internal network and NAT must be disabled
- Routing – internal networks have routes back to SSL VPN IP pool range
- Check event and SSL VPN debug logs
Tag:Fortigate
You may also like
Top 10 Network Threats & How NDR Detects Them